
The Data Point is a bi-weekly newsletter in which The Hindu’s Data team decodes the numbers behind today’s biggest stories.
The Data Point is a bi-weekly newsletter in which The Hindu’s Data team decodes the numbers behind today’s biggest stories.
(This article forms a part of the Data Point newsletter curated by The Hindu’s Data team. To get the newsletter in your inbox, subscribe here.)
Two years since the pandemic outbreak, consumers are “revenge shopping” and travelling more this year
The beginning of autumn in India also marks the beginning of the festival season. Starting with Ganesh Chaturthi in September, the Hindu festival season continues until early November, ending with Diwali. The season is marked by school and office holidays, vacations and shopping sprees. During the holiday season, many e-commerce ventures offer attractive discounts to discourage shoppers from going to physical stores. Also, the season creates new job opportunities.
In 2020 and 2021, the festival season was subdued due to the pandemic and related restrictions. The season that both customers and suppliers look forward to came and went without much fanfare. But data show that this time around, Indians were more confident about the economy. And with fewer restrictions, public mobility improved, which boosted flight travel and retail sales.
Consumer enthusiasm
The share of urban consumers pessimistic about the Indian economy continued to decline in September 2022 as COVID-19 cases and related restrictions were fewer, according to the RBI’s consumer confidence index.
Also, in September 2022, CMIE’s Consumer Pyramids Household Survey questioned households about their financial conditions and the ability to purchase commodities such as furniture, television sets and cars compared to a year ago. The results were captured as the Consumer Sentiment Index (base period: Sep-Dec 2015 = 100). The score in September 2022 was 80, considerably higher than 54.7 a year ago and 42 in September 2020. Though the score is yet to reach the pre-pandemic levels (108 in September 2019), consumer sentiments have picked up significantly compared to the first two pandemic years.
Vehicle sales
During the festival period, families usually have more disposable income and spend on their most-awaited purchases. Many companies also award bonuses to employees. Moreover, banks offer special deals on car and motorcycle loans during the holiday season. This results in an increased demand for vehicles.
Data from the Federation of Automobile Dealers Associations of India shows that after two uninspiring festival seasons, vehicle sales in the 2022 season have exceeded the pre-pandemic levels. Between September 26 and October 5 (the Navaratri season), vehicular sales reached almost 5.4 lakh in 2022. The figures were 3.4 lakh and 4.2 lakh in 2021 and 2020, respectively. During this period in 2019, 4.66 lakh vehicles were sold.
Mobility and flight travel
With most lockdown-related movement restrictions lifted, public mobility is returning to pre-pandemic levels. Notably, the rise in mobility was more pronounced this year than in the last two festival periods.
According to the Google Mobility Index, between the last week of September and the first week of October this year, visits to grocery shops, pharmacies, parks and retail and recreation centres peaked in the post-pandemic period, whereas workplace visits declined.
The index measures visits to various places by keeping the baseline (median value) as the five-week period of Jan 3 – Feb 6, 2020. So, a positive value indicates an increase in visits from the baseline period and a negative value indicates a decrease.
From the last week of September to the first week of October this year, park visits increased by 60% to 80% compared to the baseline. However, in the corresponding period in 2021, park visits ranged from -3% to 1%. In 2020 park visits were 45% lower than the baseline.
Similarly, visits to retail and recreational purposes went up by 10%-20% compared to the baseline in 2022. However, in the corresponding period in 2021, such visits ranged from -7% to -12%. In 2020 such visits were about 40% lower than the baseline.
The number of people travelling by flight is also inching towards pre-pandemic levels. More than one crore passengers flew on domestic flights in India in August 2022. Owing to movement restrictions and strict COVID-19 protocols, only 28 lakh passengers had taken domestic flights in August 2020. And while the number went up to 65 lakh in 2021, it was still only half of the number of fliers in August 2019 (1.2 crore).
Despite high inflation, people’s enthusiasm this season hints possibly at two things. Either the pent-up demand and lack of travel in the first two years of the pandemic have resulted in “revenge shopping and travel” in 2022 or there is a genuine turnaround in the economy with income levels much better this time around.
Fortnightly figures
7.41% was India’s retail inflation in September, accelerating from 7% in August. September’s retail inflation was the highest since April when price rise quickened to an almost eight-year high of 7.79%. This is the ninth month that inflation has exceeded the 6% upper tolerance threshold mandated for the RBI. Food inflation surged sharply to 8.41% last month — the steepest increase in 22 months.
Nearly 3.15 lakh Right to Information (RTI) complaints and appeals are pending with 26 information commissions across India. According to a report by Satark Nagrik Sangathan, the number of appeals and complaints pending in 2019 was 2.18 lakh. In 2020, the number climbed up to 2.33 lakh and in 2021, the number was 2.86 lakh. The highest number of cases was pending in Maharashtra at 99,722, followed by Uttar Pradesh at 44,482, Karnataka at 30,358, the Central Information Commission at 26,724 and Bihar at 21,346.
6.8% is India’s growth forecast in the current fiscal year, following 8.7% growth in the fiscal year that ended March 31 as per figures released in the IMF’s October 2022 World Economic Outlook: Countering the Cost-of-Living Crisis report. The growth rate for this year for India has been revised downward by 0.6 percentage points relative to the IMF’s June 2022 forecast, following a weaker output in the second quarter, and subdued external demand, the IMF said. The forecast for the next fiscal year remains unaltered at 6.1%.
India ranked 107 out of 121 countries analysed in the 2022 Global Hunger Index. Scoring 29, the country falls under the ‘serious’ category in the hunger meter. The country ranks below Sri Lanka (64), Nepal (81), Bangladesh (84) and Pakistan (99), with Afghanistan being the only South Asian country to lag behind India in the listing. The Global Hunger Index (GHI) is a tool for comprehensively measuring and tracking hunger at global, regional, and national levels. GHI scores are based on the values of four component indicators – undernourishment, child stunting, child wasting and child mortality. Countries are divided into five categories of hunger based on their score, which are ‘low’, ‘moderate’, ‘serious’, ‘alarming’ and ‘extremely alarming’.
Almost 70% of wild populations of monitored animal species have plummeted in the last 50 years according to a report by World Wildlife Fund for Nature (WWF). In biodiversity-rich regions such as Latin America and the Caribbean, the figure for animal population loss is as high as 94%. The report found that the main drivers of wildlife loss are habitat degradation due to development and farming, exploitation, the introduction of invasive species, pollution, climate change and disease.
Chart of the week
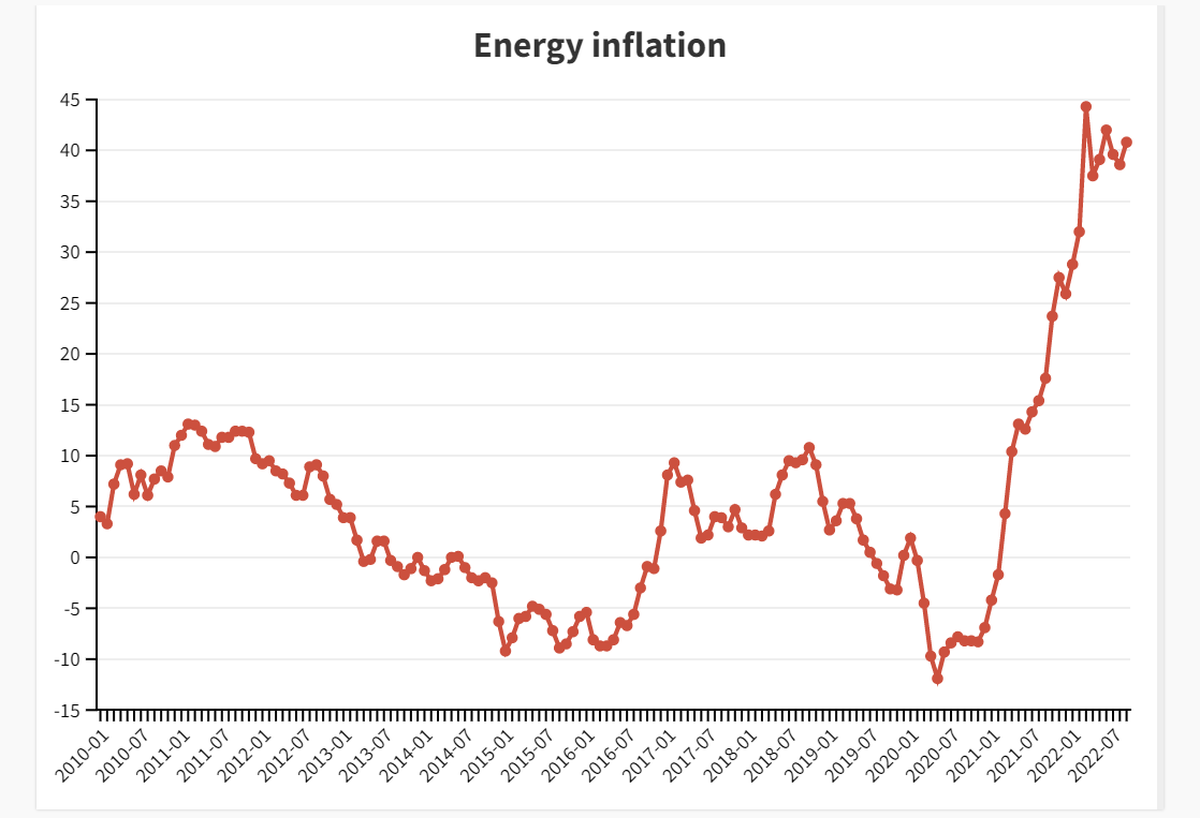
The chart shows the month-wise energy inflation rate in the European Union since 2010. Energy-related inflation in Europe started rising post the war and accelerated to over 40% in recent months. While the overall inflation and food-related inflation have surged to 10-year highs in recent days, their increase pales in comparison to the rise in energy prices. The impact of rising energy costs was felt across all European nations.
Read more about the peaking inflation in Europe since the Ukrainian invasion here.
Flashback
State-owned oil marketing companies IOC, HPCL and BPCL may for the first time post the second consecutive quarterly loss with a combined loss of ₹21,270 crore in July-September, as they held petrol and diesel prices below the cost of production for a long time, according to a PTI report. This explains why despite a decrease in international fuel prices, the retail fuel prices at fuel stations in India have remained the same in India to compensate for the losses of oil marketing companies in the earlier periods. The data point titled “Why petrol prices in India have remained unchanged despite falling crude oil costs” published on September 1, 2022, explained why retail petrol prices remained unchanged at the fuel stations while the crude prices (Indian basket) had reduced by around $20/barrel.
Aviation firm CAPA has estimated that the domestic airline industry in India could post losses of over $1.7 billion this fiscal year. IndiGo and SpiceJet have already reported losses of ₹1,064.30 crore and ₹789 crore respectively in the April-June quarter of the current fiscal year, as per PTI reports. Through data points titled, “Despite higher passenger count in November, aviation sector yet to come out of woods” published on December 26, 2021, and “Despite increase in flyers, Indian airlines struggle to turn a profit” published on April 1, 2022, the Hindu Data team had explained why the Indian airlines were struggling to turn a profit despite relaxation in movement restrictions leading to an increase in the number of flyers.
Thank you for reading this week’s edition of the Data Point newsletter! To subscribe, click here. Please send your feedback to [email protected]
For all the latest Business News Click Here
For the latest news and updates, follow us on Google News.
Denial of responsibility! NewsBit.us is an automatic aggregator around the global media. All the content are available free on Internet. We have just arranged it in one platform for educational purpose only. In each content, the hyperlink to the primary source is specified. All trademarks belong to their rightful owners, all materials to their authors. If you are the owner of the content and do not want us to publish your materials on our website, please contact us by email – [email protected]. The content will be deleted within 24 hours.